Poll results depend on pollster choices as much as voters’ decisions
Simple changes in how to weight a single poll can move the Harris-Trump margin 8 points.
JOSH CLINTON
There is no end of scrutiny of the 2024 election polls – who is ahead, who is behind, how much the polls will miss the election outcome, etc., etc. These questions have become even more pressing because the presidential race seems to be a toss-up. Every percentage point for Kamala Harris or Donald Trump matters.
But here’s the big problem that no one talks about very much: Simple and defensible decisions by pollsters can drastically change the reported margin between Harris and Trump. I’ll show that the margin can change by as much as eight points. Reasonable decisions produce a margin that ranges from Harris +0.9% to Harris +8%.
This reality highlights that we ask far too much of polls. Ultimately, it’s hard to know how much poll numbers reflect the decisions of voters – or the decisions of pollsters.
The 4 key questions for pollsters
After poll data are collected, pollsters must assess whether they need to adjust or “weight” the data to address the very real possibility that the people who took the poll differ from those who did not. This involves answering four questions:
1. Do respondents match the electorate demographically in terms of sex, age, education, race, etc.? (This was a problem in 2016.)
2. Do respondents match the electorate politically after the sample is adjusted by demographic factors? (This was the problem in 2020.)
3. Which respondents will vote?
4. Should the pollster trust the data?
To show how the answers to these questions can affect poll results, I use a national survey conducted from October 7 – 14, 2024. The sample included 1,924 self-reported registered voters drawn from an online, high-quality panel commonly used in academic and commercial work.
After dropping the respondents who said they were not sure who they would vote for (3.2%) and those with missing demographics, the unweighted data give Harris a 6 percentage point lead – 51.6 % to 45.5% – among the remaining 1,718 respondents.
Adjusting For Demographic Factors
Naturally, the unweighted sample may not match what we think the 2024 electorate will be. One way to address this is by using voters in past elections as a benchmark. But which election? The 2022 midterm election was most recent, but midterm voters differ from presidential voters. The 2020 election could be a better choice, but perhaps the pandemic made it atypical. Maybe 2016 is better.
Here’s what happens if I make these 1,718 respondents match the demographics of the 2016, 2020, and 2022 electorates in terms of sex, age, race, education, and region. (My estimates of the demographics of those electorates come from the Voter Supplement to the Current Population Survey).
The margin for Harris increases in every case. Mainly, this is because the sample is evenly split on gender – compared to the 2020 electorate, which was 53% female – and 34% of the electorate has a high school degree or less (compared to the 29% in 2020). Given differences in vote choice by age and gender, adjusting the sample to match past electorates has the effect of increasing the margin for Harris.
But of course, this adjustment is a mistake if the 2024 electorate ends up having a higher percentage of “non-college” or male voters than the 2020 electorate. There’s no way to know what is “wrong”: the poll itself, or the assumptions about the electorate that are built into the weighting scheme.
Adjusting For Political Factors
Many pollsters now worry whether survey respondents are too Democratic-leaning relative to the electorate. In this survey, 40% of the respondents identify as Democrats and 31% identify as Republicans, even after weighting the data to match the demographics of the 2020 electorate.
But it’s not clear whether this Democratic-leaning sample is a problem. It does not match some other polls, which suggest a narrower party divide. But if Democrats end up being more mobilized to vote in 2024, this partisan imbalance could be a feature of this year’s electorate.
Or maybe not. It could be that Democratic voters are just more likely to take this poll – as was the case in 2020.
If it’s the latter, then the sample is “too Democratic” and needs to be adjusted further. Two common approaches are to weight the sample by partisanship or by self-reported vote in the last presidential election. But again, the right benchmark isn’t obvious.
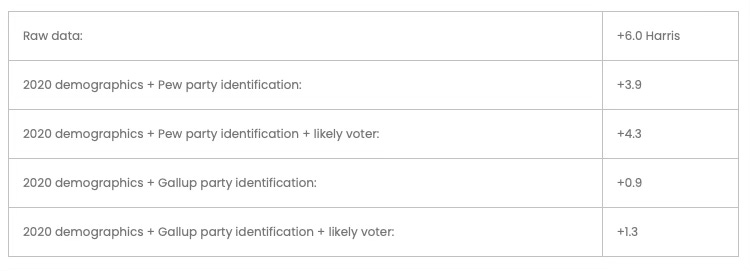
For partisanship, pollsters often rely on benchmarks such as the Pew Research Center’s National Public Opinion Research Sample, which suggests that the country is evenly split – 33% Democrat, 32% Republican, and 35% independent – or Gallup’s tracking survey, which suggests that 28% are Democrats, 31% are Republicans and 41% are independents. If I adjust the raw data by both the demographics of the 2020 electorate and these party identification benchmarks, Harris’ margin is greatly reduced relative to the raw data and demographics alone:
For past vote, pollsters typically ask respondents how they voted in 2020. Putting aside concerns about false or mistaken recollections, using past vote assumes that 2020 Biden and Trump voters will replicate the 2020 outcome by voting at the same rate in 2024. Using past vote also requires deciding how many voters who didn’t vote in 2020 will vote in 2024.
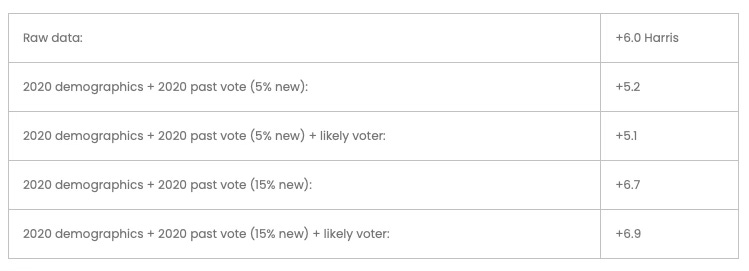
Weighting the sample based on past vote also narrows Harris’ margin relative to purely demographic weights, but the effect depends on how many new voters we think there will be in 2024.
Because the 25% of this sample who said that they didn’t vote in 2020 support Harris by a 58 to 42 margin, the higher the percentage of new voters we choose, the higher the margin for Harris. The numbers below assume that 5% or 15% of the 2024 electorate is composed of voters who did not vote in 2020.
Adjusting For Likely Voters
So far, we have assumed that every respondent who prefers Harris or Trump will vote. But that’s obviously wrong.
This poll asked respondents to rate their likelihood of voting on a 1-10 scale, where 1 means they definitely will not vote and 10 means they definitely will. Here is what happens if I weight the sample so that each respondent counts “more” if they reported a higher number on that scale.
First, because Democrats are slightly more enthusiastic than Republicans who are themselves slightly more enthusiastic than independents in this data, adding the likely voter weight moves the margin ever so slightly towards Harris:
Adding a likely voter weight has smaller effects if we have already weighted by 2020 demographics and 2020 vote:
This is because the average likelihood of voting doesn’t vary much by past vote in this data.
Do I Trust This Data?
After all of this, there is still a critical limitation. Even if we correctly predict what the 2024 electorate will look like in terms of demographics and partisanship, our adjustments only work if the voters who took the poll have the same views as similar voters who did not take the poll. This is a foundational assumption of polling.
Suppose the independents in our poll’s sample – who split 51-49 for Harris – are too pro-Harris, perhaps because Trump-supporting independents just don’t like taking polls. If so, weighting our sample to match the expected percentage of independents in the electorate will not solve the problem even if we correctly anticipated the percentage of independents in the 2024 electorate.
In fact, if the independents in the sample are the “wrong” independents, adjusting the sample to give them more weight would make the poll less accurate!
Tempering Unreasonable Expectations
Even though many people complain about how inaccurate preelection polls can be, it is actually astounding that the polls are as accurate as they are given how many choices a pollster must make.
I’ve shown that reasonable choices about how to weight a poll can produce up to an 8-point shift in the Harris-Trump margin. That’s a larger number than the “margin of error” and the expected margin in most battleground states. In a close election like this one, a pollster’s choices can radically alter a poll’s results.
The performance of polls thus depends on the opinions of both voters and pollsters in ways that are often hard to discern. This election year, are the polls virtually tied because voters are tied, because pollsters think the race is tied, or both?
We would all do better to temper our expectations about preelection polls. It’s impossible to ensure that the polls will reliably predict close races given the number of decisions that pollsters have to make. And it’s often hard for consumers of polls to know how much the results reflect the opinions of the voters or the pollsters.
Josh Clinton is the Abby and Jon Winkelried Chair and professor of political science at Vanderbilt University. He is also the co-director of the Vanderbilt Poll and co-director of the Center for the Study of Democratic Institutions at Vanderbilt. The data and code for this analysis are available here.


